Make sense of your logs with Elastic Search - part 1: tips to improve your logs
2019-03-14In my current project, when something goes wrong, we have trouble finding out what and where exactly.
Why? Can't we just see what happens in the logs?
Yeah… but with great effort… We have several issues making sense of our logs.
In this article, I'll demonstrate how Elastic Search can help us to address these needs.

1. We have an asynchronous, parallel flow of data
This makes it difficult to separate logs of the flows from each other.
3 users doing actions at the same time, now try to find out who caused which logs...
2. Each component writes logs in its own file.
To get a complete picture we have to search in at least in tens of files.
Good luck hunting!
3. Each log file can be structured differently.
2 examples:
Apache access logs:
127.0.0.1 - - [05/Feb/2012:17:11:55 +0000] "GET / HTTP/1.1" 200 140 "-" "Mozilla/5.0 (Windows NT 6.1; WOW64) AppleWebKit/535.19 (KHTML, like Gecko) Chrome/18.0.1025.5 Safari/535.19"Log of internal component:
2018-04-13 19:12:57 [34mINFO [0;39m [36mAbstractConsumer.info(173)[0;39m - Message with ID:d694ce4ec17b-43179-1523646549357-665:1:4:1:1 has been successfully received.What do we need to make sense of our logs?
We want to filter the logs that belong to a specific action, without the noise of everything else that occurred at the same time.
We want our logs to be structured in the same way. Reading through all kinds of different-structured data is harder, and can be confusing.
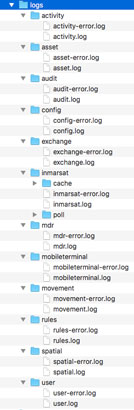
We need to have the logs in 1 single view. Opening up dozens of files is just a pain in the ass.
In this article, I’ll demonstrate how Elastic Search can help us to address these needs.
So, how does Elastic Search help me understand my logs?
The title of this blogpost gave it away that I thnink we can meet these needs with Elastic Search. What magic does Elastic Search bring to the table, then?
Since there is a lot to tell about Elastic Search, I’m splitting up this blogpost in multiple bite-size parts.
At the end of this series, you'll have
mapped the meaningful parts of your logs in a database.
- This means that you can search, sort, filter, group on these log parts.
the ability to easily create (real-time) graphs, allowing you to visualize patterns.
- Are there rare circumstances in which an operation takes a high amount of time?
- Do you have memory leaks and is the software operating slower and slower over time?
- Does an unusual amount of exceptions pop up during certain use cases?
- Given you log the data, all this can be visualized!
Before deep diving into Elastic Search and its magic, let's have a good look at the input that we'll be feeding it.
First things first: let’s improve the quality of our logs
Elastic Search will not magically give you insights in what's happening in your system, if you don't feed it the right data.
As with everything in the software world: crap in = crap out.
So, our first step is to have a good look at ours logs and check out how we can make them as useful as possible.
1. A correlation id: a small step for development, a giant leap for debugging
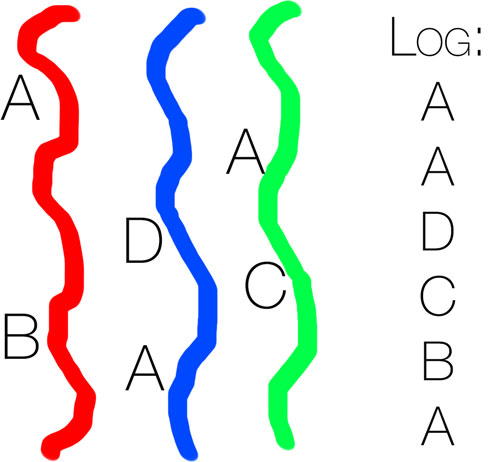
When actions are executed simultaneously, it can be difficult to separate the logs from each other.
2 users doing actions at the same time.
The resulting log is:
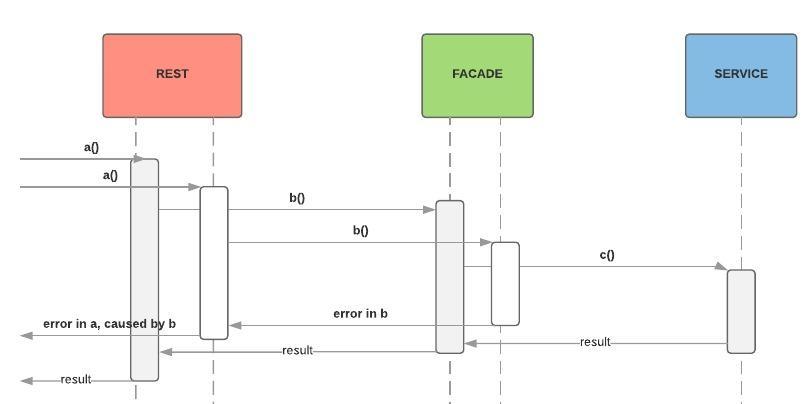
    a invoked by user A
    a invoked by user B
    b invoked
    b invoked
    c invoked
    error in b
    result in c
    error in a, bubbling up from b
    result in b
    result in a
Who had the error? It's not clear.
What can we do about this?
It would help if we could differentiate logs from flows with an identifier.
- When user A executes an action, every log for that action contains id "123".
- If another user is executes an action at the same time, the logs for that action contain id "456".
2 users doing actions at the same time. A correlation identifier has been added.
The resulting log is:
    (123) a invoked by user A
    (456) a invoked by user B
    (123) b invoked
    (456) b invoked
    (123) c invoked
    (456) error in b
    (123) result in c
    (456) error in a, bubbling up from b
    (123) result in b
    (123) result in a
Who had the error? The user who invoked action 456, so B!
How to create such a correlation id?
Ok, so we need an identifier per action. How to realize this?
Coming from a Java web applications world, I’ve done this is often done by creating a Mapped Diagnostics Context, or in short: MDC.
You can see MDC as a static variable coupled to a user’s thread.
When a user starts an action, for example by calling a webservice, a random number is assigned to the thread that gets started.
Every time that something is logged, the log line gets prepended by that MDC number from the current thread.
When communicating with another application (or a different thread), the MDC number is passed through in some way. For example, when calling another web service, the current MDC number gets posted as a HTTP header.
When an MDC number is passed through, the other application sets this MDC number in its own MDC context, so that its logs also contain that same MDC number.
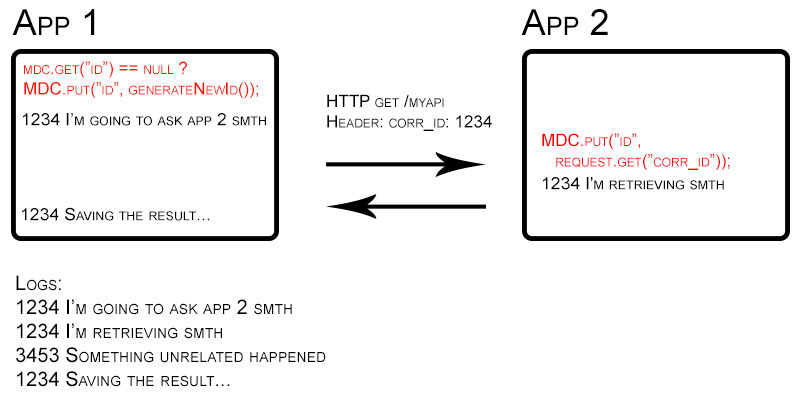
This way, for one user action, all applications involved write logs with the same MDC number! So now, I can see what my user action has triggered, in all my applications, just by looking for this specific number.
Most popular Java logging frameworks support a MDC right out of the box. For more information, have a look at this excellent post from Baeldung.
2. Have a specific timestamp for every log line
Being able to order your logs chronologically is crucial. How else are you going to know which is the cause and which is the consequence?
You may think, “Yes, of course my logs have a timestamp”. Well, as stupid as it may sound, I’ve seen log lines without a timestamp, or timestamps that aren’t very specific (leaving out the milliseconds).
Computers are fast, so for true chronological ordering, don't strip off the milliseconds!
3. Put in recognizable keywords or characters
Let's take a look at this log line:
2019-02-11T12:32:00.234 STIHFT 12345 It took 5.6 seconds to save the document.We want to extract the following tags:
- timestamp (2019-02-11T12:32:00.234)
- username (STIHFT)
- correlation id (12345)
- the duration (5.6 seconds)
- the action (save the document).
We need to tell Elastic Search how to find this specific data.
- The first part with an ISO 8601 format is the date
- Then, the following word is the user id.
- The following number is the correlation id.
- If you find the string "It took", then the next number is the duration and the word behind it is the time unit.
- Finally, take all the words after " to ", to find the action.
Have a good look at your logs and make sure that you can come up with a pattern. Keep it consistent and simple!
I’ve seen logs that separate log parts with a certain character, like |. Not super pretty, but it’ll do the job!
4. Less is NOT more
Let's say that multiple users are working on multiple documents at the same time. One user now says: the software did something weird when I was working on document A, yesterday. I don't remember at which time.
"No problem", you say. "I have this excellent thing called Elastic Search, I will find out what went wrong!".
Turns out that the user id is logged only in certain logs. When an exception happens, it’s not logged who has triggered this exception…
When something goes wrong, what will your search terms be? If you’ll search on the username, make sure it’s logged in every log line!
Let's pump the logs into Elastic Search!
Ok, so now we have better, more consistent logs, packed with useful information. Let’s head to part 2: what is Elastic Search?