Make sense of your logs with Elastic Search - part 2: what is Elastic Search?
2019-03-30Ok! Hopefully we're now at a point where we have logs with timestamps, tons of information, all structured in a recognizable way.
Let's now pump our logs in an Elastic Search database, so that we can start searching, filtering, distilling information out of them!
Elastic Search, work your magic please! Right?

Pumping our logs over in an Elastic Search database to enjoy the magic
Ok! Hopefully we’re now at a point where we have logs with timestamps, tons of information, all structured in a recognizable way.
Let’s now pump our logs in an Elastic Search database, so that we can start searching, filtering, distilling information out of them!
Elastic Search, work your magic please! Right?
Elastic Search is a stack of software components
When talking about Elastic Search, people seem to refer to a single piece of software. Yet, when talking about “Elastic Search”, you’re strictly speaking about the database.
To get data in and out of this database, you’ll need multiple software components working together, forming an Elastic Search stack.
What software components do we need?
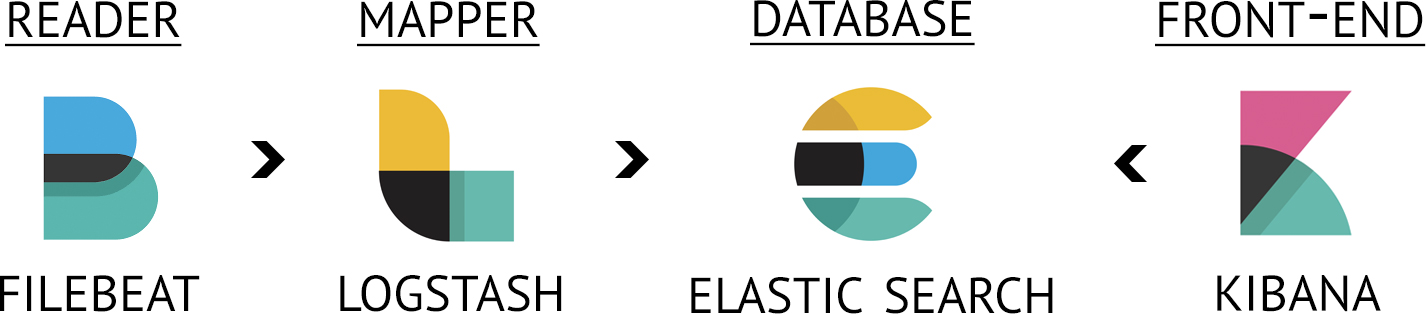
To get from a load of separate log files to 1 searchable overview, we need to execute the following steps. For each step, we need to use a specific component
- Read the logs
- Filebeat will watch the log files and check for changes.
- Map the log lines in parts. Which part is the user id, which part is the correlation id, which part is…?
- Logstash will take care of this.
- Save these parts in a superfast database, making the logs queryable.
- This database is Elastic Search.
- View and search through the logs with a fancy front-end application.
- May I present you to: Kibana!
So, how does Elastic Search help me understand my logs?
At the end of this series, you'll have
mapped the meaningful parts of your logs in a database.
- This means that you can search, sort, filter, group on these log parts.
the ability to easily create (real-time) graphs, allowing you to visualize patterns.
- Are there rare circumstances in which an operation takes a high amount of time?
- Do you have memory leaks and is the software operating slower and slower over time?
- Does an unusual amount of exceptions pop up during certain use cases?
- Given you log the data, all this can be visualized!
What are the system requirements?
When we have a look at the official docs, we’ll se that:
- The Elastic Search stack is heavy on RAM.
- In my experience, and for a relatively light volume of logs, it’s a good idea to give Logstash at least 1 GB of RAM and Elastic Search DB needs 4 GB.
- In the docs, they speak of 64 GB for the entire machine. It all depends on how much load you’re going to throw at it.
- The speed of the processors doesn’t really have a great impact. The software is highly optimized for multithreading, so more processor cores can help.
- Disk speed is extremely important.
- You'll also need a good amount of disk storage. Elastic search copies over all your logs files in its database, you know.
Install the software
Heads up: a Docker enthusiast will get loose!
To set up the Elastic Search software, I’m using Docker and Docker compose. The reason: Docker makes it very easy to reproduce the same set-up. If you have Docker and Docker compose installed, reproducing my setup is simply pulling the Git library and executing “docker-compose up”.
If cannot or do not want to use Docker, or want to manually install the Elastic Search software, everything in this article still applies. It’s just a matter of putting configuration files in the right place.
You can find an example of a Docker and Docker-compose setup on my Github.
All I need to do is:
git checkout https://github.com/stainii/ElasticSearchForUnionVMScd ElasticSearchForUnionVMSdocker-compose up –d- put my the logs of my application (UnionVMS) in /app/logs/
- Have some patience until everything has booted up.
You can find all necessary config files in the repository.
With Docker, I boot up every module and give the containers access to the config files.
An example section of my Docker-compose file:
...
    filebeat:
    image: "docker.elastic.co/beats/filebeat:6.6.0"
    volumes:
    - ./filebeat/filebeat.yml:/usr/share/filebeat/filebeat.yml => here, I map the config
    - /app/logs/:/app/logs/ => here, I give Filebeat access to the logs
    - ./filebeat/data:/usr/share/filebeat/data => Filebeat’s data will be synced with my local computer. When the Filebeat container gets killed, I don’t lose the data.
    networks:
        - elk
...
Let’s configure every module!
Ok... so I’ve provided example config files. But what’s in them? How to tune them to your needs?
In the next parts of this series, we’ll go deeper into configuring every module.